

by Hassan Keshavarz
Financial analyst at Jolan Financial Systems Inc. A startup in BC, Canada
Financial statements highlight based on Jolan’s analyzing method
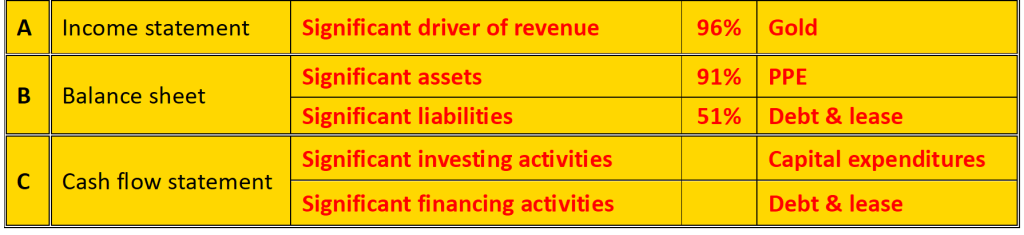
- Significant driver of the revenue: Gold
Gold is the main source of the Kinross income. It is almost 96% of the revenue; the rest is silver, considered a gold by-product, and both metals are found together in nature. Kinross has gold mines worldwide: Africa, north and south America.
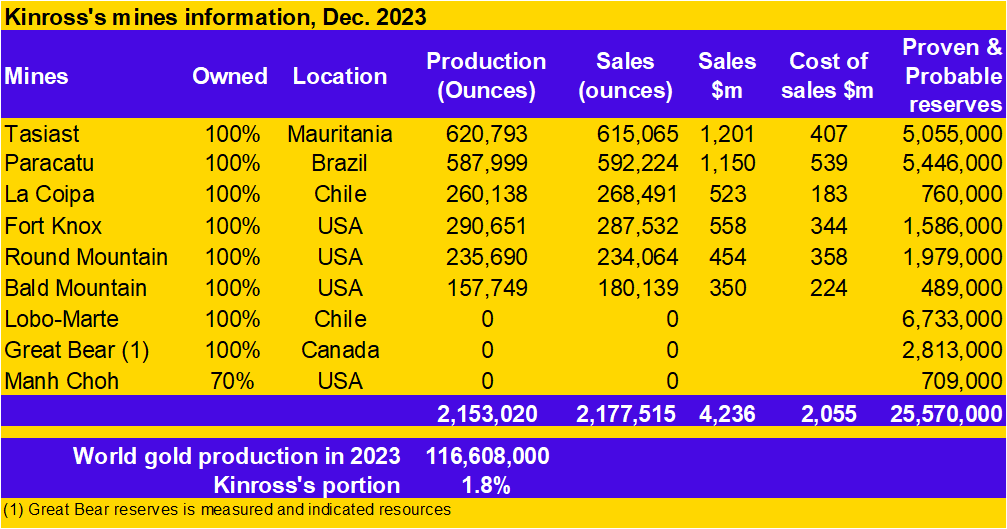
The greatest are Tasisat in Mauritania and Paracatu in Brazil. The proven and probable reserves of the company are 25,750,000 ounces, about 12 years of production, including the new and developing mines (Lobo-Marte, Great Bear, and Manh Choh).
A.1. The macroeconomic conditions of Gold
This precious metal has served as a reliable store of value and a hedge against economic uncertainty for centuries. In 2024, the price has risen to about 20% in the recent months. What are the reasons and what will be the trend? The factors of gold’s demand and supply must be scrutinized:
- Inflation: The inflation rate has gone far enough from the 2022 rates and could not be the main reason for the increasing price, although the inflationary expectations are still there.
- Currency movement: Based on experts, the dollar will continue to demonstrate strength but it should theoretically keep the gold price lower. So this is not the reason either, and the question is why the historical gold-dollar relationship doesn’t work anymore.
- Geopolitical events: Many political risks occurred months ago and still they are. Geopolitical events potentially bring risks and they affect gold prices.
- Interest rate: The interest rates remain high and the Fed still has not started rate cuts. A high interest rate could be an encouraging element for the increasing gold price.
- Central bank policies: The chart below indicates that in 2022 and 2024 the central banks’ demand for gold has remarkably risen. The central bank’s activities should be considered very important because they reflect and confirm all the above economic and geographical conditions.
- Investor sentiment, jewelry consumption, and industrial uses: There is no sign of significant change in these elements in the chart.
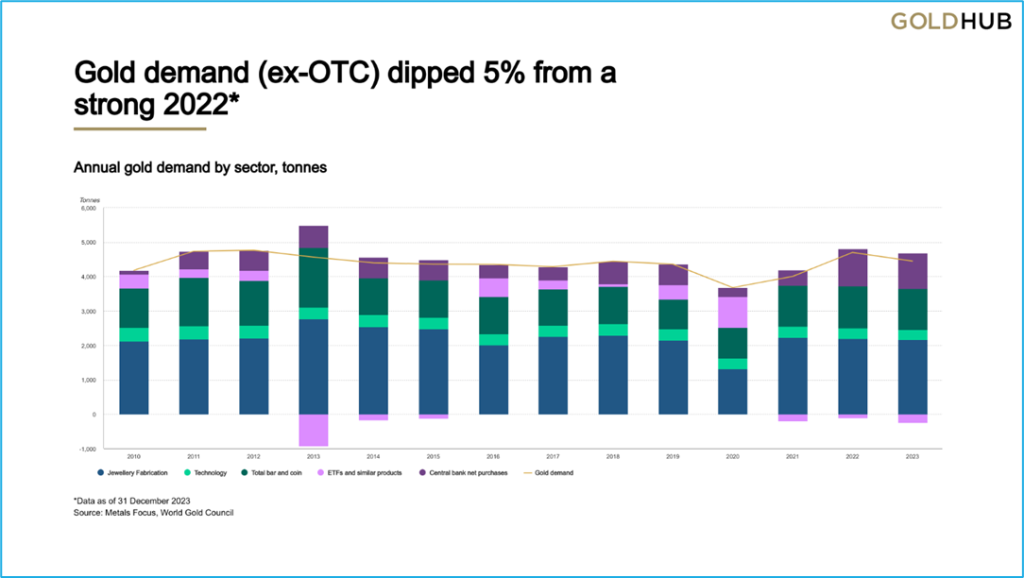
To summarize, in terms of demand, there are still economic and geopolitical reasons for the increase in the price of gold, and gold mining companies are expected to have better performance.
In terms of supply, the gold supply is influenced by factors such as mine production, recycling, central bank sales, and producer hedging. Changes in mining output, exploration activities, and geopolitical factors can impact the supply of gold in the market. Generally, it does not seem that there have been any significant changes in the supply side that would increase the price of gold.
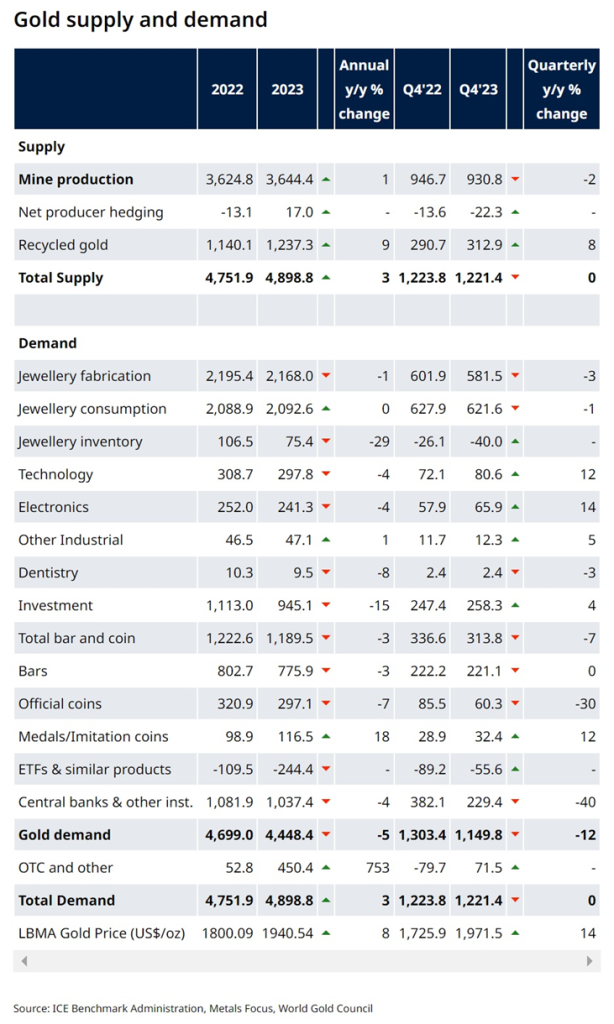
In 2023, the global gold production was almost 3,644 tones. The whole supply including 1,237 tones from the gold recycling reached 4,898 tones. As a result, the figures have been slightly greater than in 2022.
A.2. Gold cost & revenue
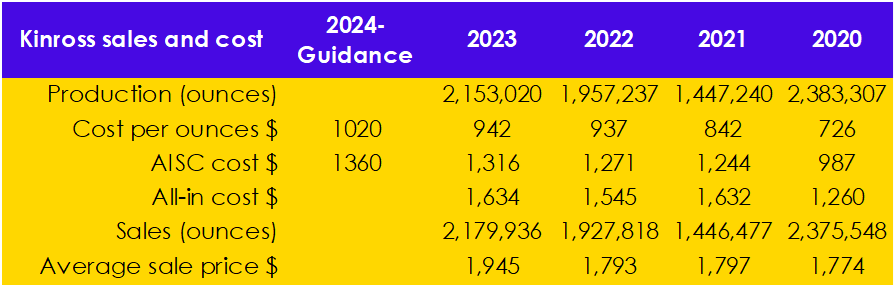
For 2024, the production has been estimated at 2.1 million ounces, which will remain around the 2023 figures. However, in terms of production cost, with the estimated cost per ounce of $1,020 and AISC of $1,360 for 2024, a decrease in the net income could be expected if the gold price remains at the 2023 levels. But the average gold price has increased more than 10% in the initial months of 2024 and if the trend continues, the net income will increase even more than in 2023.
Besides, although the production will not significantly increase, the momentum of AISC and All-in cost will be restricted, which means that Kinross has been able to control the whole structure of production systems during the inflationary time.
The ratio of AISC cost to sales price for 2023 was %68 and this ratio would be 56% for 2024, assuming an average price of $2,400 for gold. On the other view, comparing 2022 and 2023, as sales increased the cost and gross profit ratio have been better in 2023 (48%,73%) compared to 2022 (52%, 85%). With the rising price of gold, it is predicted that the ratios will be even better in 2024.
Therefore, with the assumption of stabilizing all factors of production, the gold price would have a golden role in the company’s performance in 2024.
- Significant items of balance sheet
B.1. The most important asset of a mining company is the mineral properties, plant, and equipment (PP&E). A mining company has to permanently perform maintenance, sustain, and develop the PP&Es. The figures indicate that there is no significant purchasing of new equipment. However, the table below indicates that the sustaining expenses in capital expenditures have been in a constant rate, about 2%.
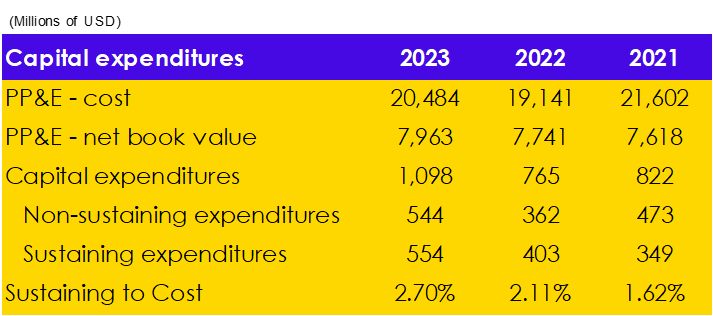
For 2024 guidance, the capital expenditures are expected to be $1,050m including $500m for sustaining expenditures and $550m for non-sustaining ones. Kinross’s capital expenditures outlook for 2025 and 2026 is $850m and $650m, respectively.
The controlling and decreasing figures might imply on one side the company’s abilities to efficiently manage, and on the other side express the lack of any program to develop and expand existing or new mines, which has led to no remarkable increase in company production in recent years.
B.2. Financing and debt
Debt and lease liabilities (current & long-term) had a range trend in 2021, 2022, and 2023, $1,590 million, $2,557 million, and $2,233 million respectively. The finance cost has slightly increased from $82 million to $106 million in the same period, which may be due to the recent interest rates rising. The debt ratio remained around 21% which is considered a favorite situation. The data also indicates that Kinross has not been interested in resource development through financing activities. Not increasing the level of production also indicates the managers’ lack of enthusiasm for development in this way.
- Significant items of the cash flow
In 2023, the net cash from operating activities was the highest compared to 2022 and 2021, whereas the cash used in investing activities has been less than in 2022. The extra cash has been used partly for reducing and clearing the financing activities and partly for capital expenditures.
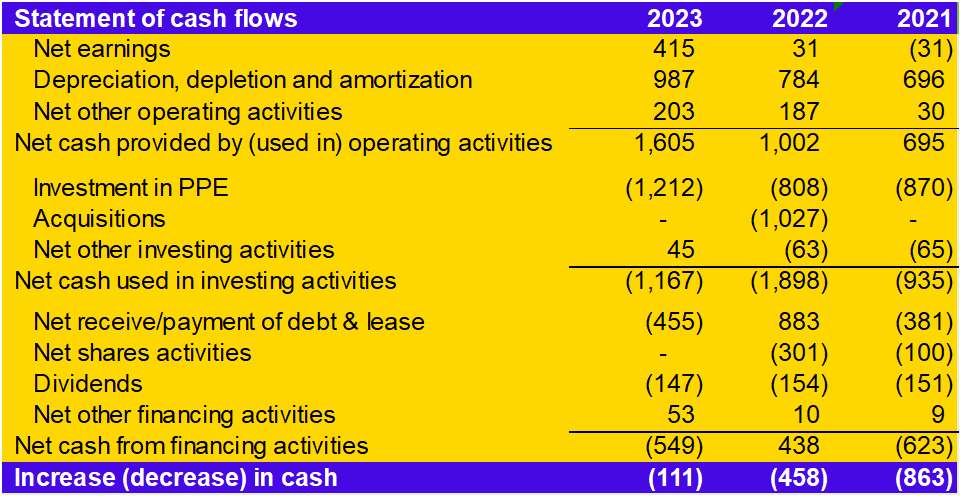
Finally, the cash flow statement also confirms the result of this analysis:
More sales, less investing, less financing.